Pinterest Engineering put out a post last week called Safe and Efficient Multi-Epoch Embedding Training, and one number in it would not leave my head. Their Homefeed ranking model has huge ID embedding tables, one learned vector for every Pin, and when they trained it for two epochs instead of one, their offline save metric dropped by almost 6 percent. Training longer made the model worse, sharply.
Their fix is lovely and a bit strange. Freeze the embedding table, train everything else, and only let the table move in the very last epoch. That recipe beat both the one-epoch model and the fully frozen one, and it shipped with a 1.09 percent lift in online saves. They also built a pipeline that reads each batch's embeddings one step early, which makes them slightly stale, and they report no quality cost from that.
The post explains what works, and is careful not to overclaim why. So I did what any normal person would do on a Monday night. I broke the problem down from first principles, rebuilt the whole thing small enough to run on Kaggle's free GPUs, ran almost 300 training runs across five kernels, found a bug in my own setup that was faking most of the effect, and ended up with a different picture than the one I started with. "The table overfits on the second epoch" turned out to be three separate problems that just happen to look the same from the outside.
why a table would get worse with more training
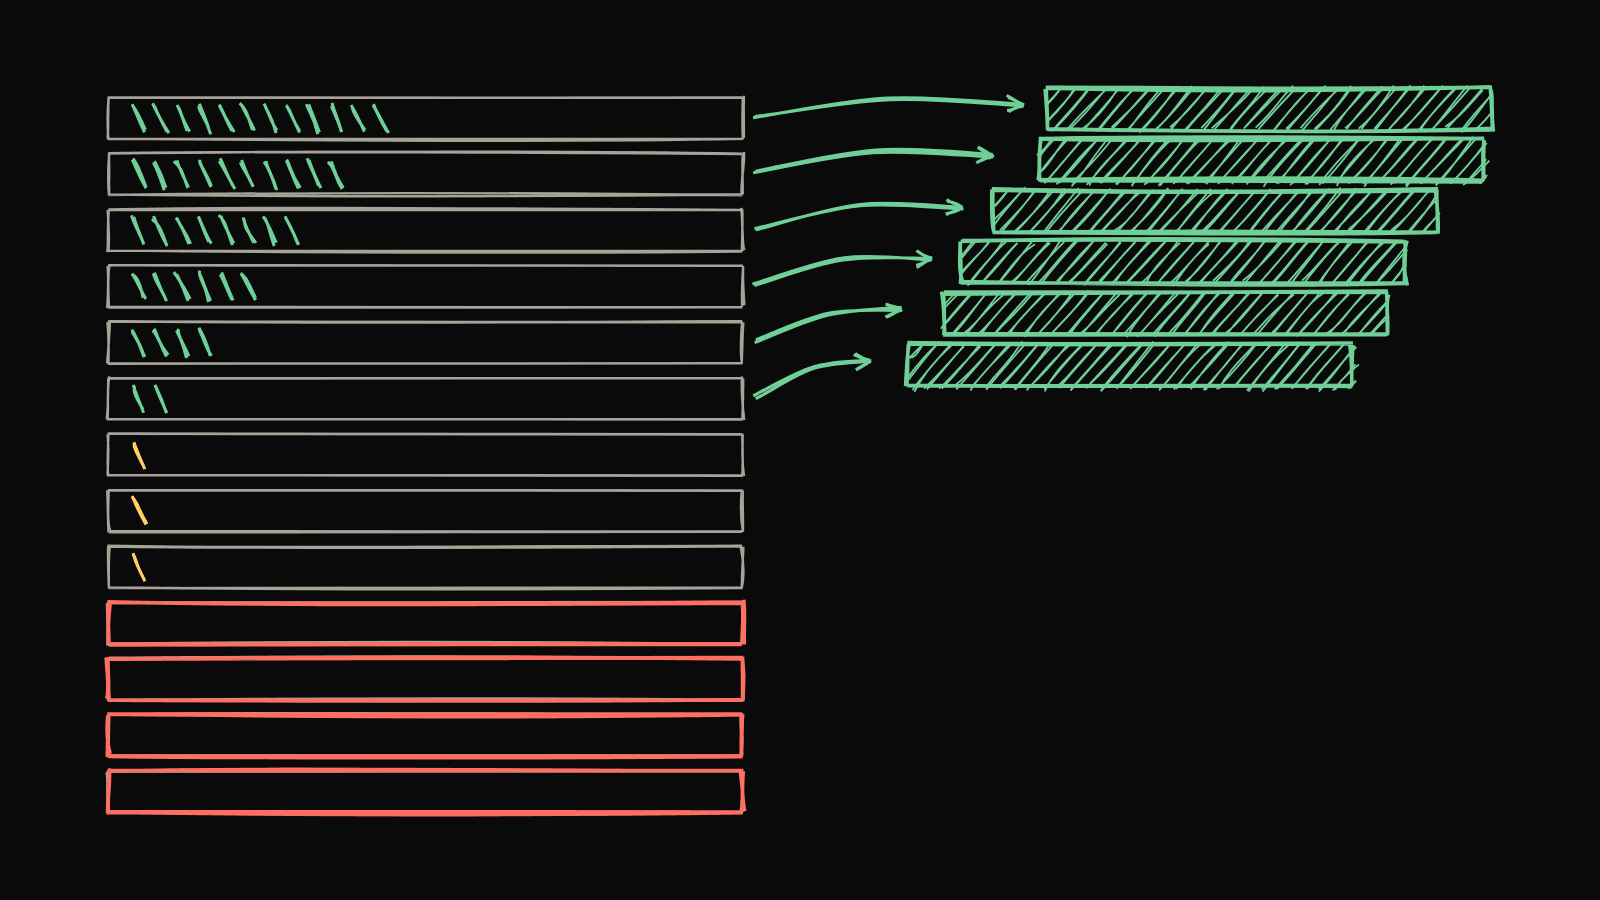
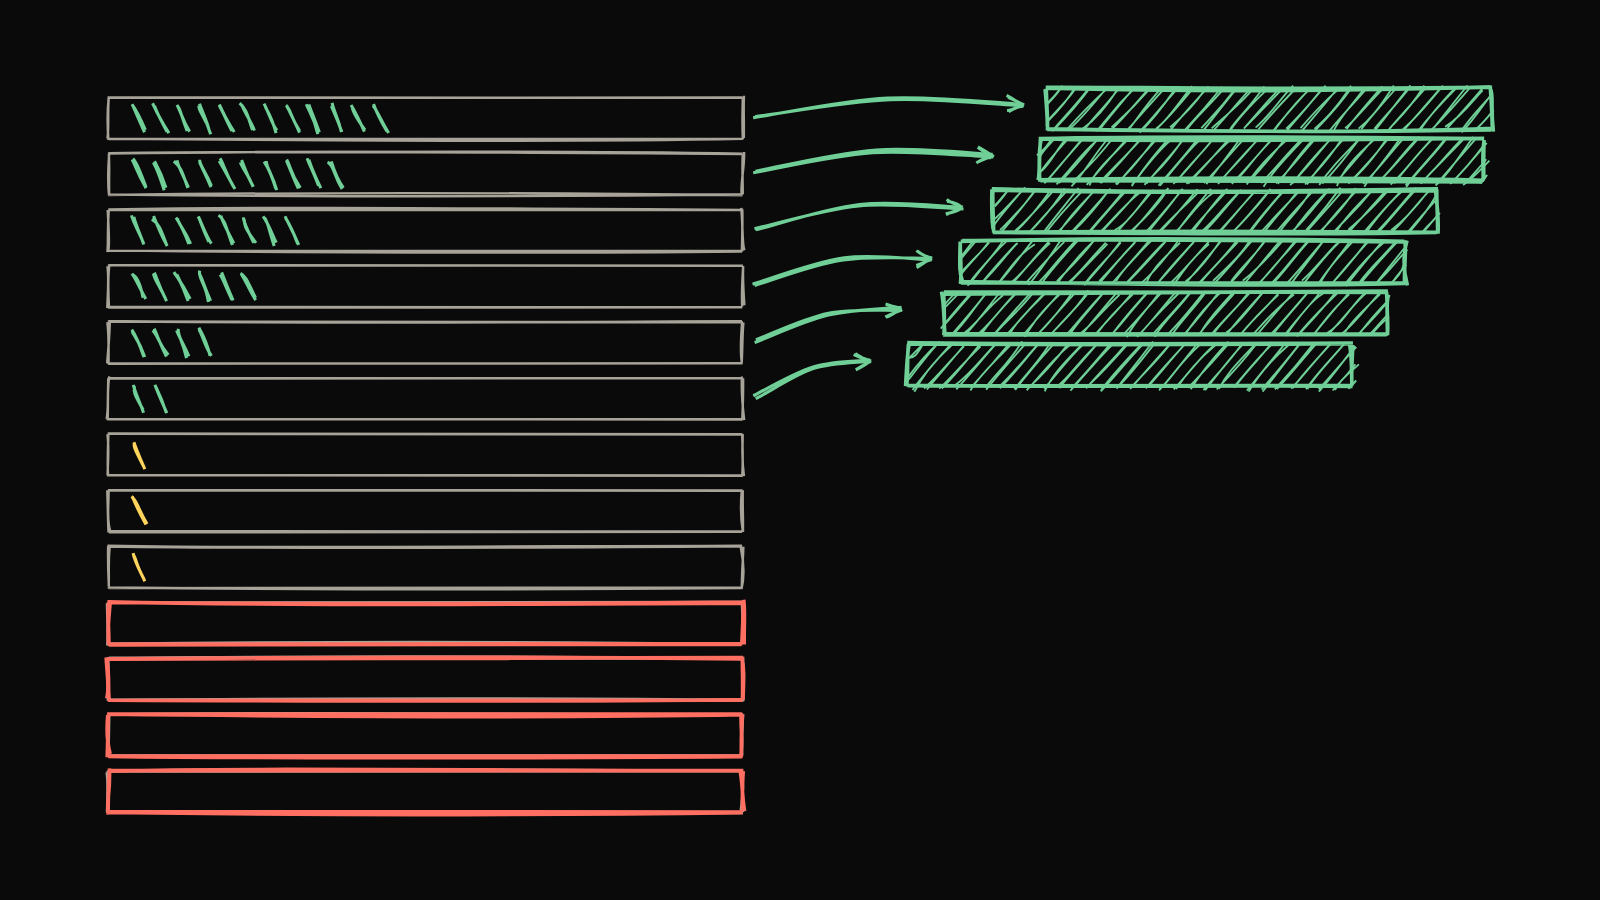
Think of the embedding table as a giant notebook with one page per item. Every time a user engages with an item, or ignores it, the model scribbles a small correction on that item's page. Popular items get thousands of scribbles, so each one barely matters and the page ends up describing the item well. Rare items get a handful, so each scribble is a big chunk of everything that page knows.
Now run the same data again. A rare item's page already contains marks written by the exact examples you are about to show the model again, and a deep network is very good at noticing that kind of shortcut. That's the folk explanation of the "one-epoch phenomenon" in recommender systems, and it's been written about since at least 2022. The table has enormous capacity and very uneven updates, so on the second pass it memorises instead of learning.
The shape of the data is what makes this bite. In the slice of MovieLens-20M I used (10,000 users, a time-based split into pretrain, fine-tune and test windows), only 517 items are "head" items with lots of fine-tune data. Most of the catalogue never shows up as a rated item in the fine-tune window at all.
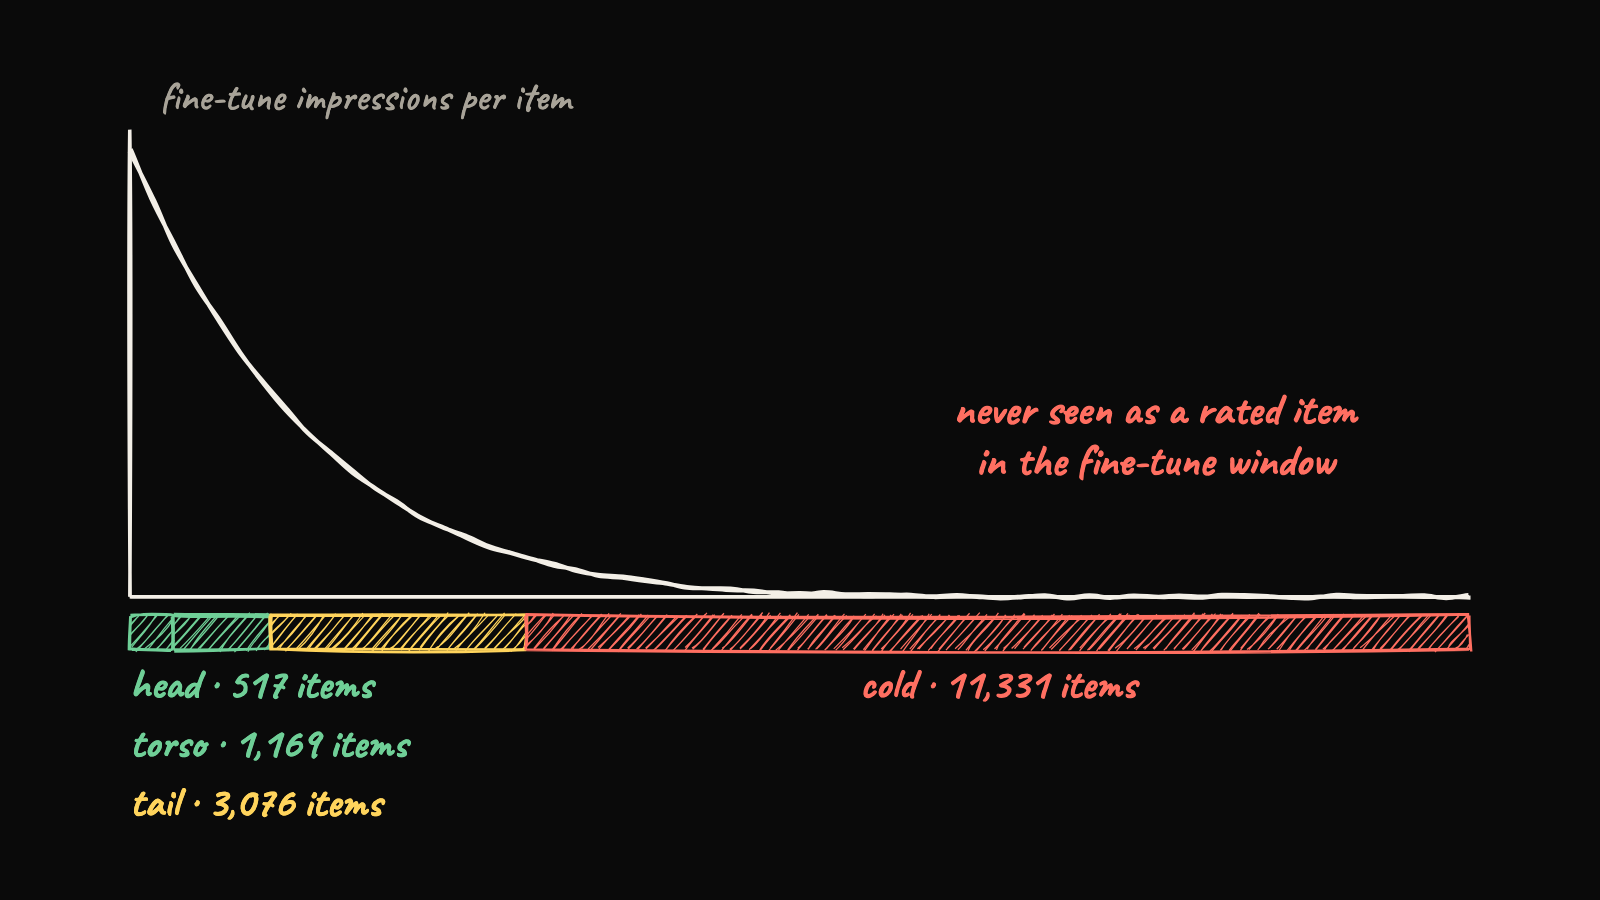
That last group, the cold items, ended up mattering way more than I expected.
how I tried not to fool myself
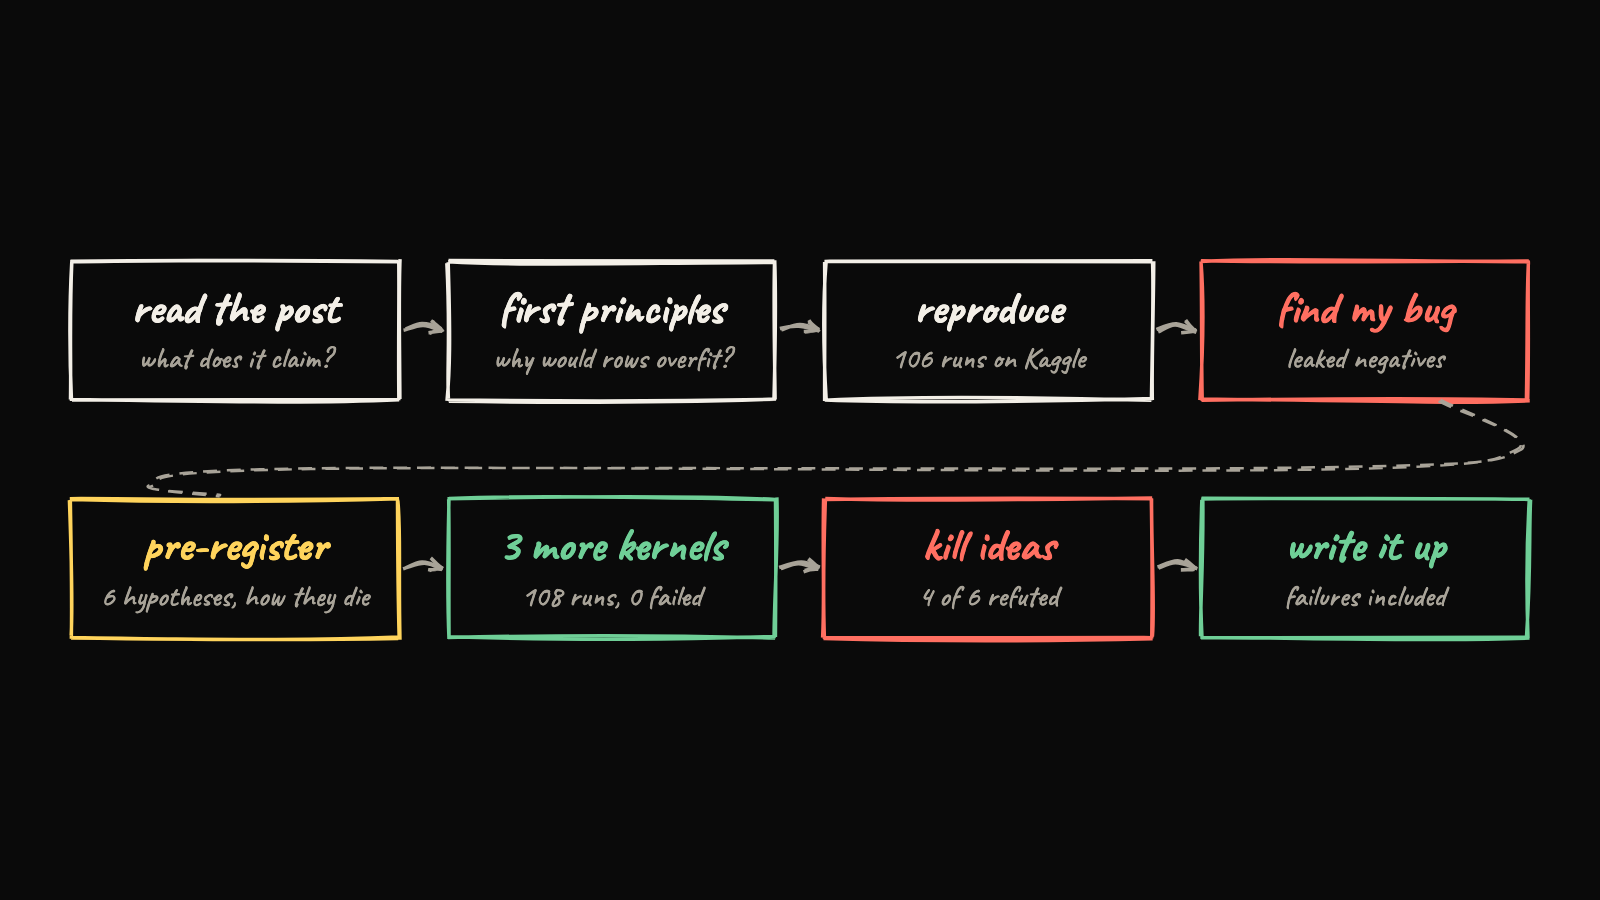
I used the same loop as in my cuprate superconductor post, but this time I ran it as four parallel research sessions. One read the literature and derived the mechanisms from first principles. One rebuilt the modelling result. One went after the systems claims (staleness, learning-rate scaling, the custom kernels). The last one only started after the first three reported back, with hypotheses written down before any of its experiments ran.
The model is a small cousin of what Pinterest describes. A 64-dimensional item table is first pretrained with a contrastive next-item objective, then fine-tuned inside a ranking model. That ranking model has a transformer over the user's history with cross-attention to the candidate item, a DCN feature-cross tower that also reads the candidate embedding directly, click-style heads, a pairwise ranking loss and the contrastive loss kept as an auxiliary. It's about 0.38M dense parameters, so tiny by production standards. Every configuration ran with three seeds, every comparison is paired by seed, and I report test AUC separately for head, torso, tail and cold items, because the pooled number turned out to lie in both directions.
it didn't show up, then it did, then it was my bug
On MovieLens-1M there was no one-epoch problem at all. Full co-training got better from epoch 1 to epoch 3, by +0.90 AUC points, and freezing the table made no difference. So the reproduction session ran a search over 14 regimes: higher learning rates, different optimizers, bigger tables, less data per row, no pretraining. The phenomenon finally showed up on MovieLens-20M with a 30× higher learning rate on the table. Frozen beat full co-training by 4.30 AUC points at epoch 3. That's the Pinterest picture, so I was happy for about a day.
Then the per-tier numbers came in and something was off. Within popular, mid and rare items, co-training was doing fine, better than frozen in every warm tier through epoch 2. The whole pooled loss came from cold items, whose positive examples got a mean logit of −6.44 under co-training against −1.51 with a frozen table. The model had decided cold items are things nobody ever engages with.
The cause was in my negative sampler. It drew negatives from item popularity over the whole dataset, including items that were only rated after the fine-tune window. Those items' rows got gradients during fine-tuning, but only ever with label 0, so the model faithfully learned "never engaged" for exactly the items that would show up as positives at test time.
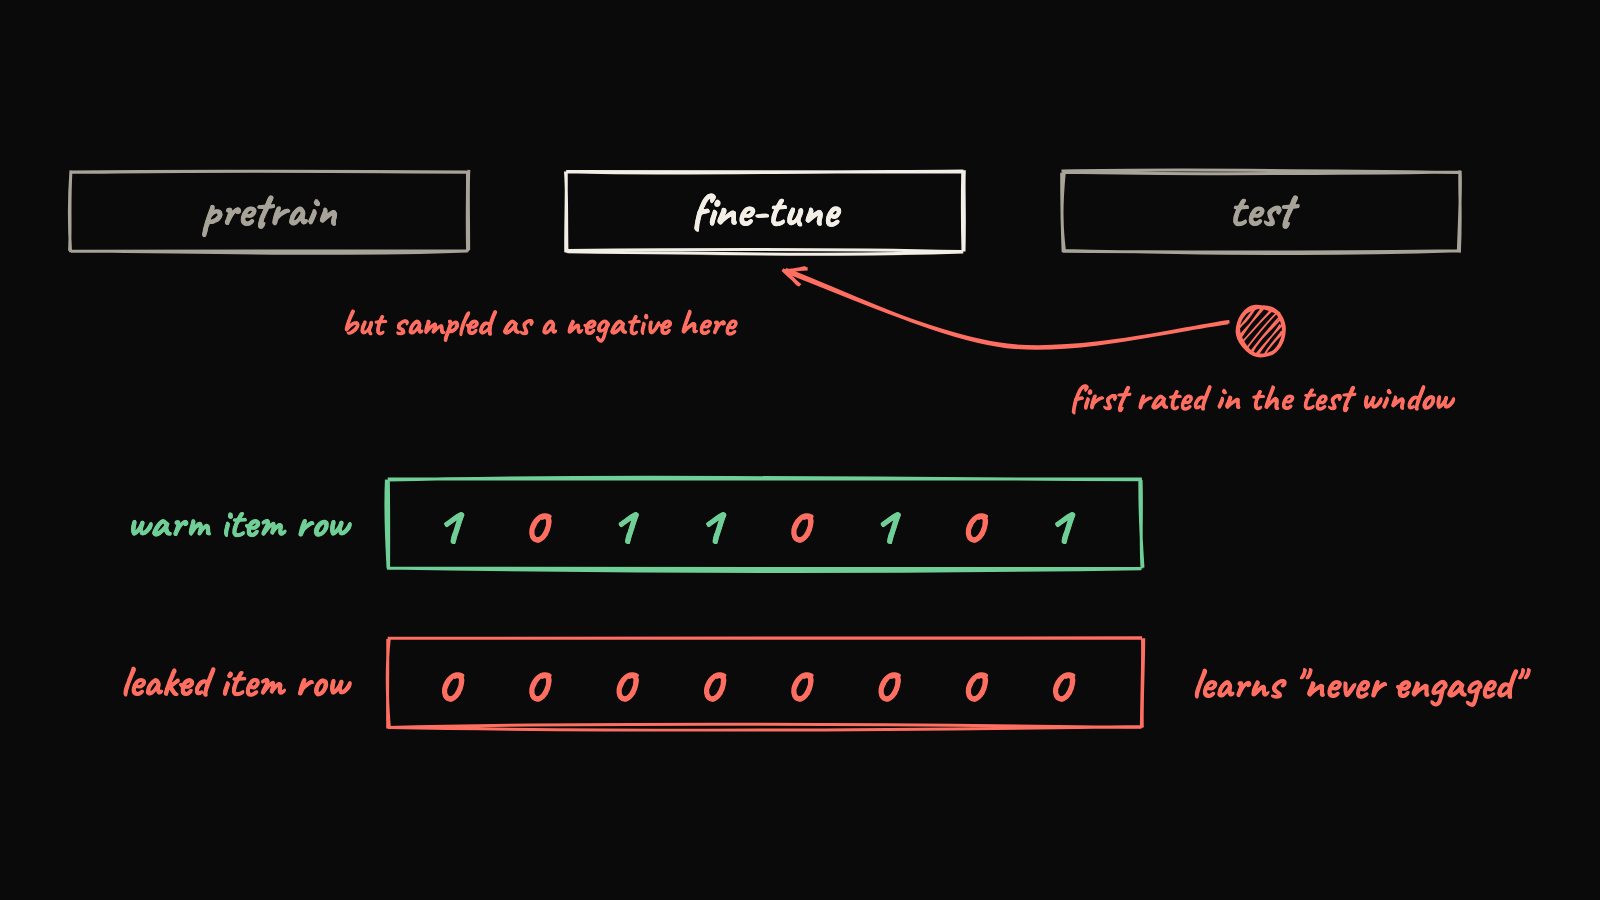
Fixing the sampler removed 84 percent of the gap at the high learning rate, which shrank from +4.30 to +0.70. At the default learning rate the "phenomenon" didn't just shrink, it flipped. Full co-training beat the frozen table by 1.02 points, and kept improving through epoch 3.
I want to be careful here. This is a bug in my reproduction, not in Pinterest's system, and their setup is nothing like mine. But I'd bet a cup of chai that some fraction of "embedding tables overfit on epoch two" stories in the wild are really "some rows only ever see negatives" stories. In a real system that can happen without anyone writing a bug: items with tiny exposure, sampled negatives drawn from the full catalogue, or new items whose first impressions are all non-clicks.
what's left is three different problems
With the leak fixed I still had two real things to explain. At the high table learning rate there is a genuine, mild degradation: pooled AUC drops 0.49 points from epoch 2 to 3, and 1.29 points on tail items. And at the default learning rate, Pinterest's freeze-until-last recipe still wins, by +0.23 over full co-training, +0.55 over training the table first and then freezing it, and +1.24 over the frozen table. Sliding a one-epoch update window later inside a two-epoch run improves things steadily, +0.02, +0.09, +0.25, +0.26 for later and later starts, which matches the article's "roughly linear" trend.
The catch is where freeze-until-last wins. All of its gain over full co-training is on cold items, +1.45 points, while warm items are slightly worse (−0.13). It isn't preventing memorisation, because at that learning rate there's nothing to memorise. It's doing something else.
So the new-hypotheses session set up experiments where two different explanations would predict different outcomes. Out of that came this picture.
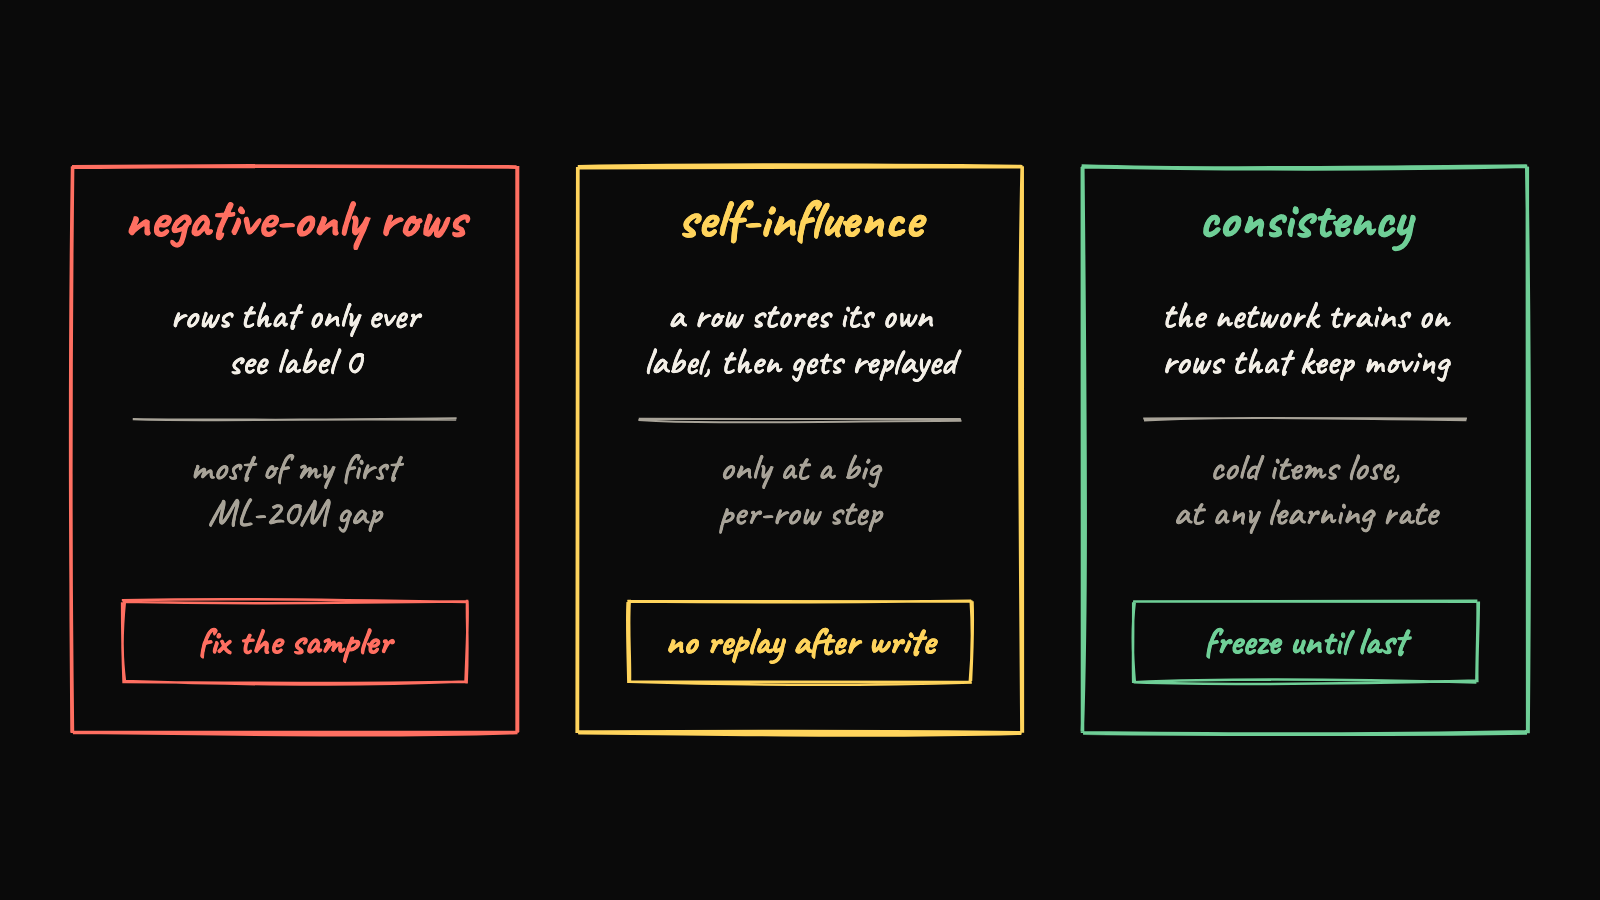
Negative-only rows are the bug above. Self-influence is the textbook memorisation story, but it turns out to need two ingredients at once. Consistency is the one I didn't see coming, and it's what freeze-until-last is mostly fixing in my setup.
self-influence is real, but only with a big step
The cleanest test I could design goes like this. Train the table during the first third of training only, then freeze it. For the rest of training, the network either replays the same examples, whose labels are now baked into their item rows, or sees fresh examples it hasn't seen before. Then subtract the same replay-versus-fresh difference for a model whose table was never trained at all, so the general cost of repeating data cancels out. Whatever is left is the cost of the network reading label traces in the rows.
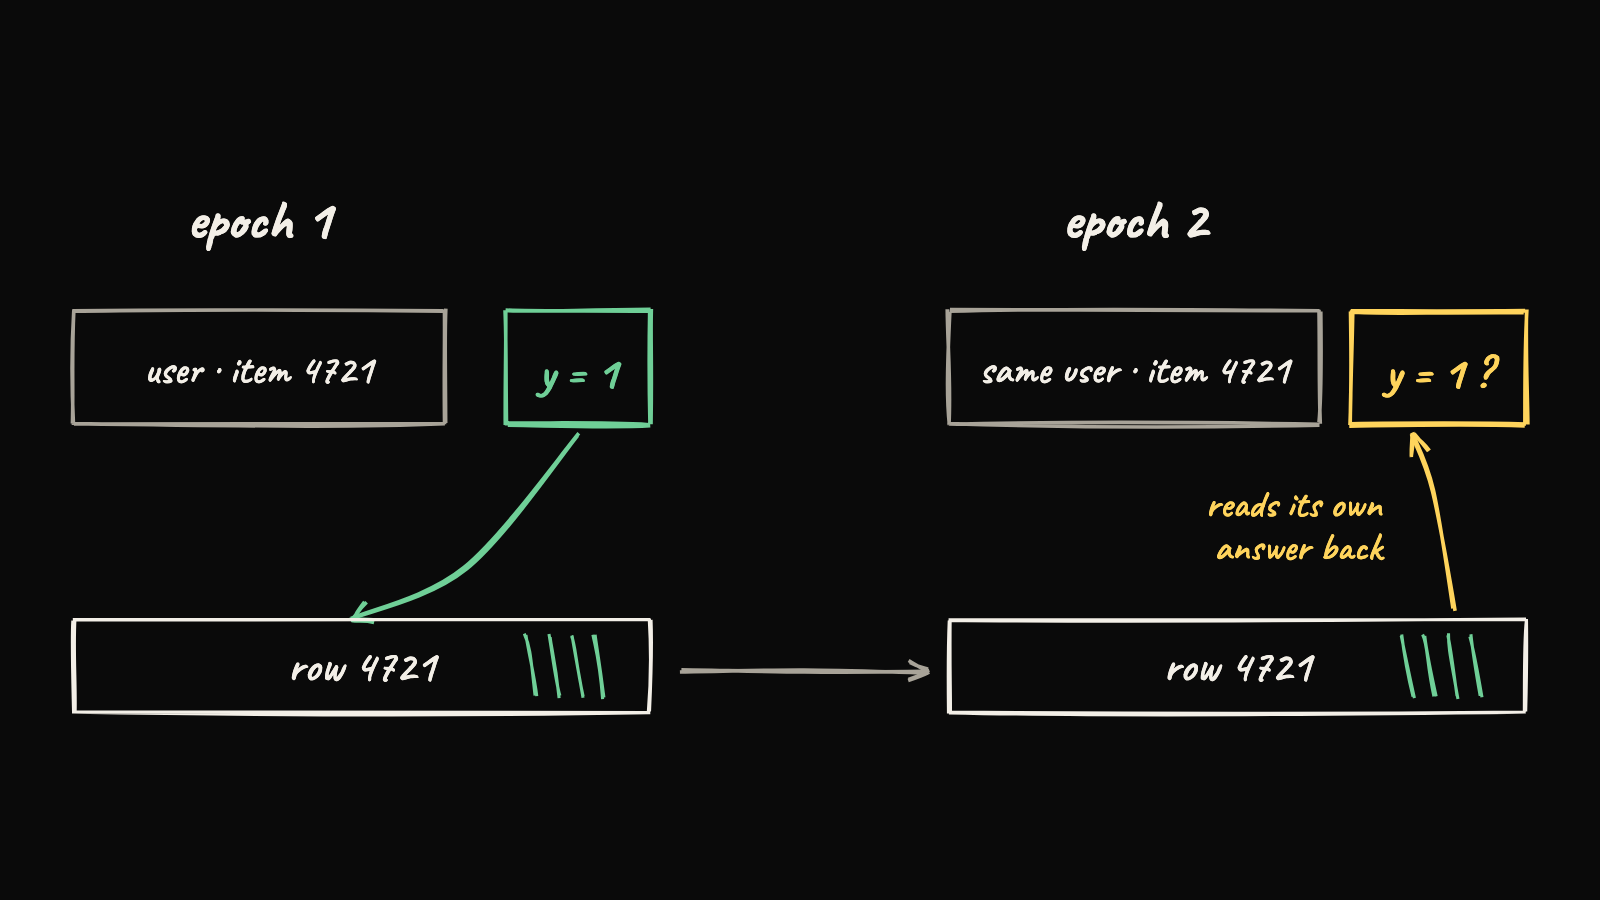
At the high table learning rate that difference-in-differences is +0.51 ± 0.16 AUC points, and +1.91 on tail items, with all three seeds agreeing. The table is frozen during the replay, so this isn't the table continuing to memorise. It's the rest of the network learning to read its own answers off the rows. At the default learning rate the same number is −0.04 ± 0.13, basically zero.
So self-influence needs a large per-row write and a later replay of the same example. Remove either one and it goes away. Freeze-until-last removes the replay, because no example is ever seen again after its row was written.
consistency, or why cold items get stranded
The second mechanism shows up even when nothing is being memorised. During co-training, the rows that get gradients move, sometimes a lot, and the ranking network moves with them. The cold rows never get a gradient, so they sit exactly where pretraining left them, while the network they feed into has learned to look somewhere else.
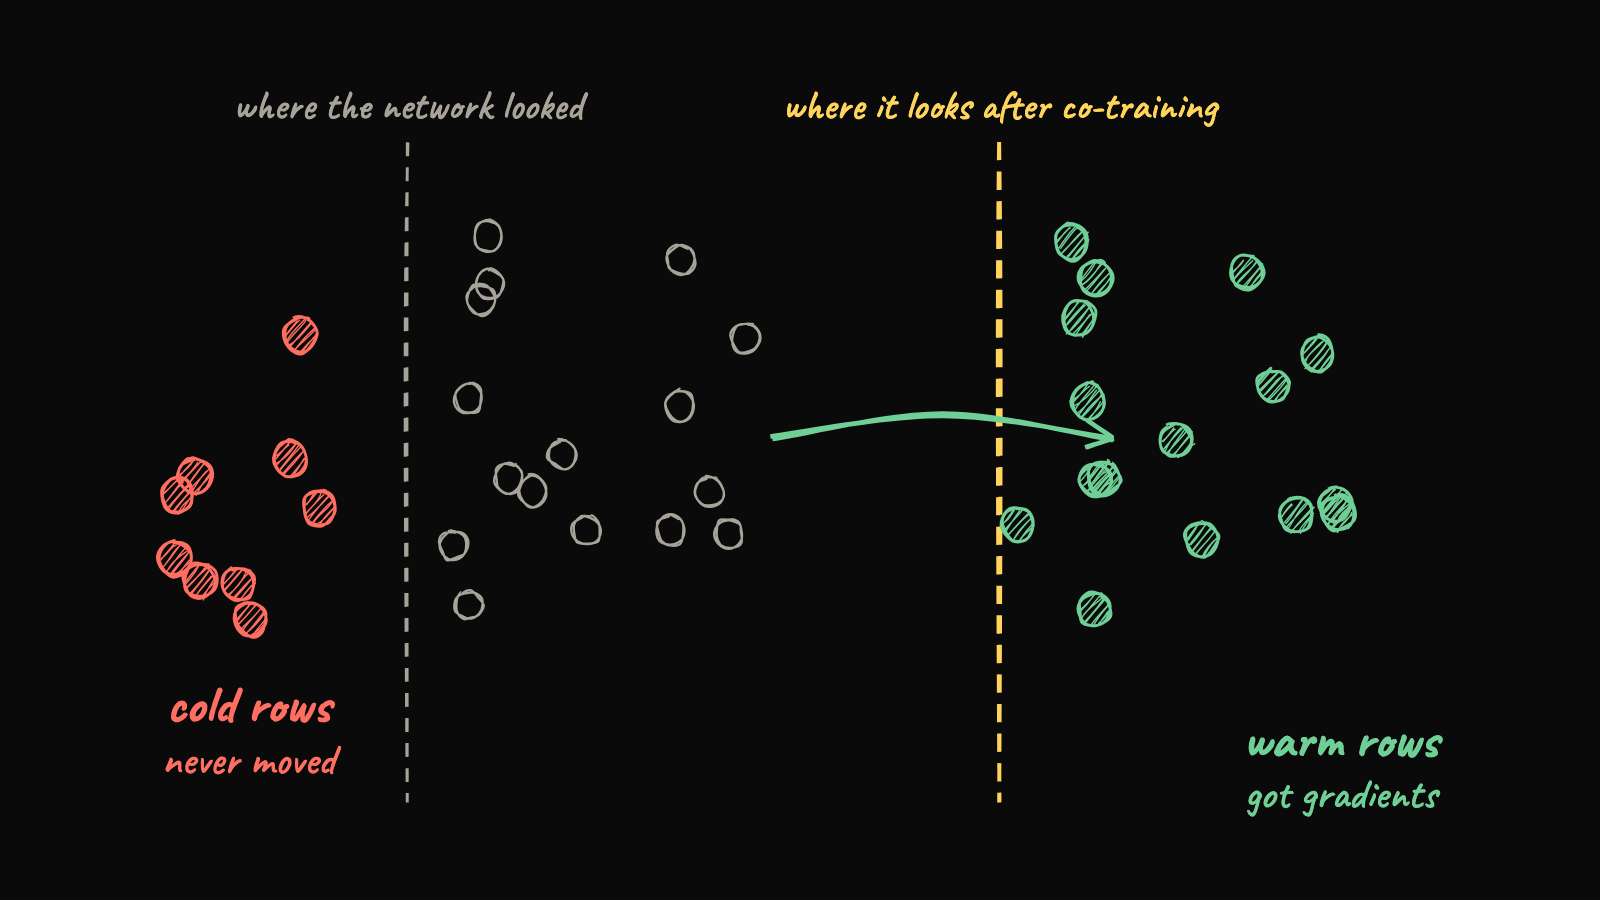
The experiment that pinned this down was re-anchoring. At the start of every epoch I reset the table to the pretrained one, so the final table is exactly what freeze-until-last produces: one epoch of adaptation from the pretrained rows, with the same tail drift (8.2 vs 7.9 times the pretrained norm at the high learning rate). The only difference is that the network spent the earlier epochs chasing moving rows instead of a fixed table. On warm items the two tie. On cold items re-anchoring loses by 1.23 points at the default learning rate and 2.23 at the high one.
Stratified unfreezing tells the same story from another angle. Train popular rows from the start and rare rows only in the last epoch, and warm items get a little better than freeze-until-last (+0.23), but cold items drop by 2.34. Every recipe that lets some rows move while the network adapts pays for it on the rows that didn't move.
This is my best guess for why freeze-until-last is so robust. It's the one recipe that handles both problems at once: nothing is replayed after its row is written, and the network trains against a fixed table for most of training.
The explorer below has the real numbers from the Kaggle runs. Toggle the learning rate, pick a recipe, and compare it against full co-training, freeze-until-last or the frozen table. The timeline shows when the table actually trains, and the two readouts on the right say whether a recipe exposes the model to self-influence, to the consistency problem, or both.
the optimizer was a bigger deal than the schedule
At the high learning rate I had a suspect lined up. PyTorch's dense Adam keeps momentum for every row, so after one gradient a rare row keeps moving for many steps with no new information. I checked it live in the notebook: the total movement is about 31.7 times the learning rate per coordinate, against 3.16 for lazy (sparse) Adam, which only moves rows that have a gradient, and exactly 1 for row-wise Adagrad's first step. Ghost momentum, I figured.
I was wrong about that. Lazy Adam halves tail drift, and the epoch-3 drop survives completely (−0.57 vs −0.49). What actually removes the drop is limiting how big a row's trace can get. A hard cap at three times the pretrained norm does it (+1.55 over full co-training). Pulling rows back toward the pretrained table, weighted by how rare they are, does it too (+1.29). And plain row-wise Adagrad, whose per-row step shrinks as that row accumulates gradient, does it best: +1.63 points over full co-training, tail drift of 1.1× instead of 14.9×, and no epoch-3 drop at all.
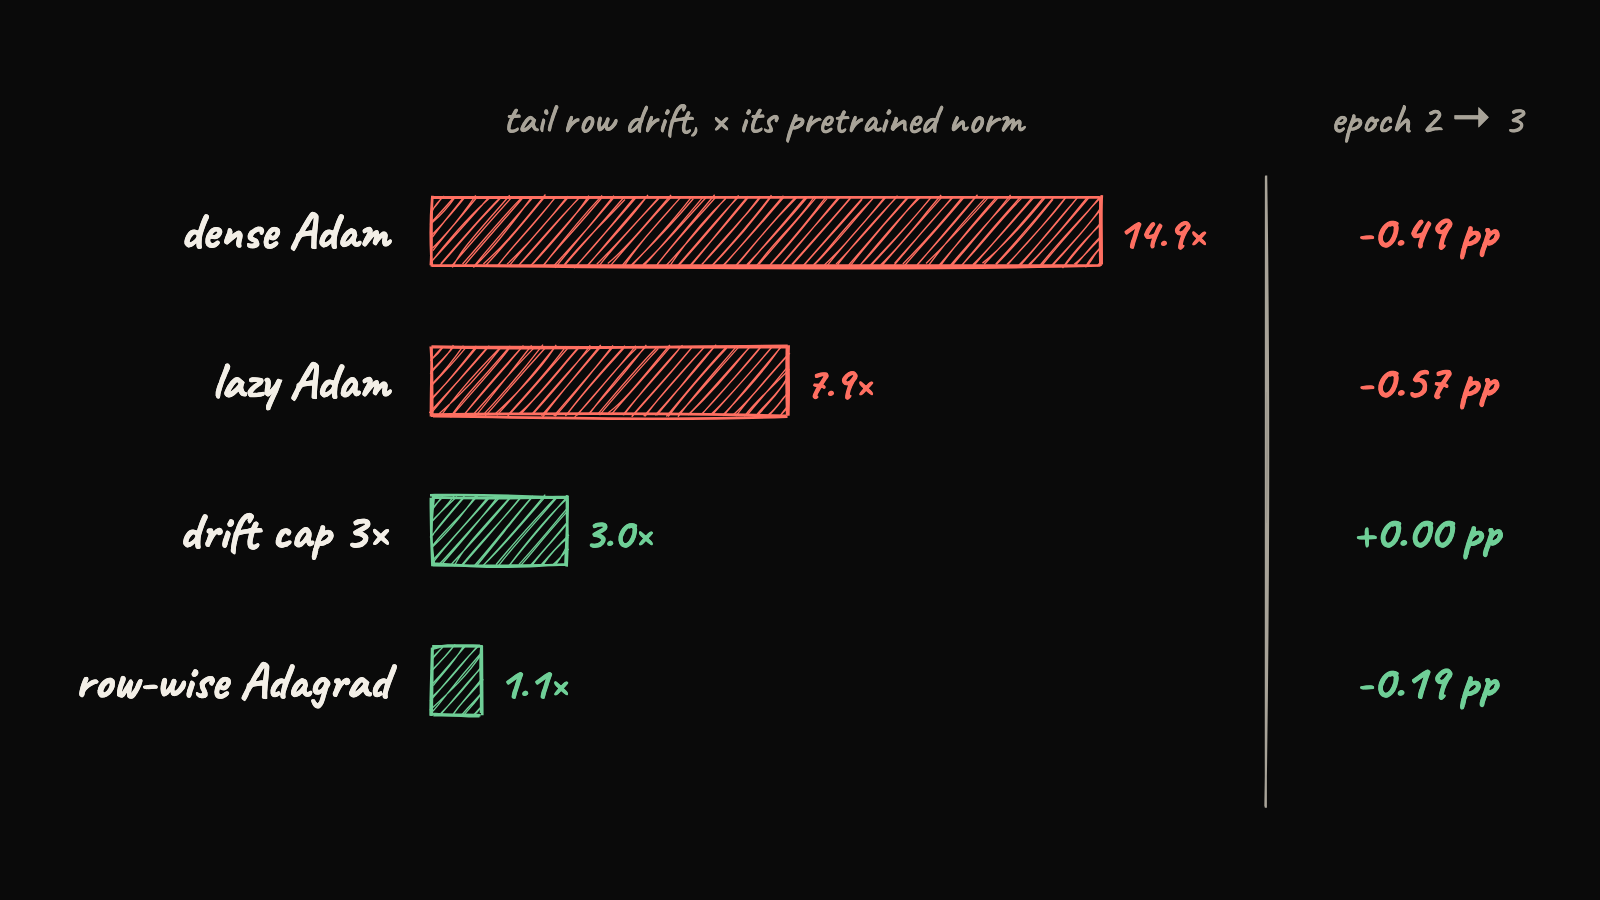
Row-wise Adagrad ties freeze-until-last with no freezing schedule (−0.27 ± 0.33), and it's the optimizer production sparse stacks like TorchRec and FBGEMM commonly use. My practical read is that part of what gets reported as a one-epoch phenomenon in dense-Adam setups is an optimizer artifact. It still loses on cold items though, because the consistency problem doesn't care about step sizes.
One idea from my pre-registered list did the opposite of what I predicted. Scaling each row's learning rate by the square root of its frequency, so rare rows move less, was the worst fix of the lot, with cold items down 5.86 points. Starving rare rows while popular rows keep moving is just the consistency problem made worse.
the surprise was a tiny shared adapter
This one I had pre-registered as a negative result. The idea was a zero-initialised shared map applied to every embedding before it goes into the network, e ↦ e + eA + b, with A and b trained along with the rest of the model. My prediction was that it would do nothing, because the network's first layers already apply shared linear maps to the embedding. On a frozen table that's roughly what happened (+0.19).
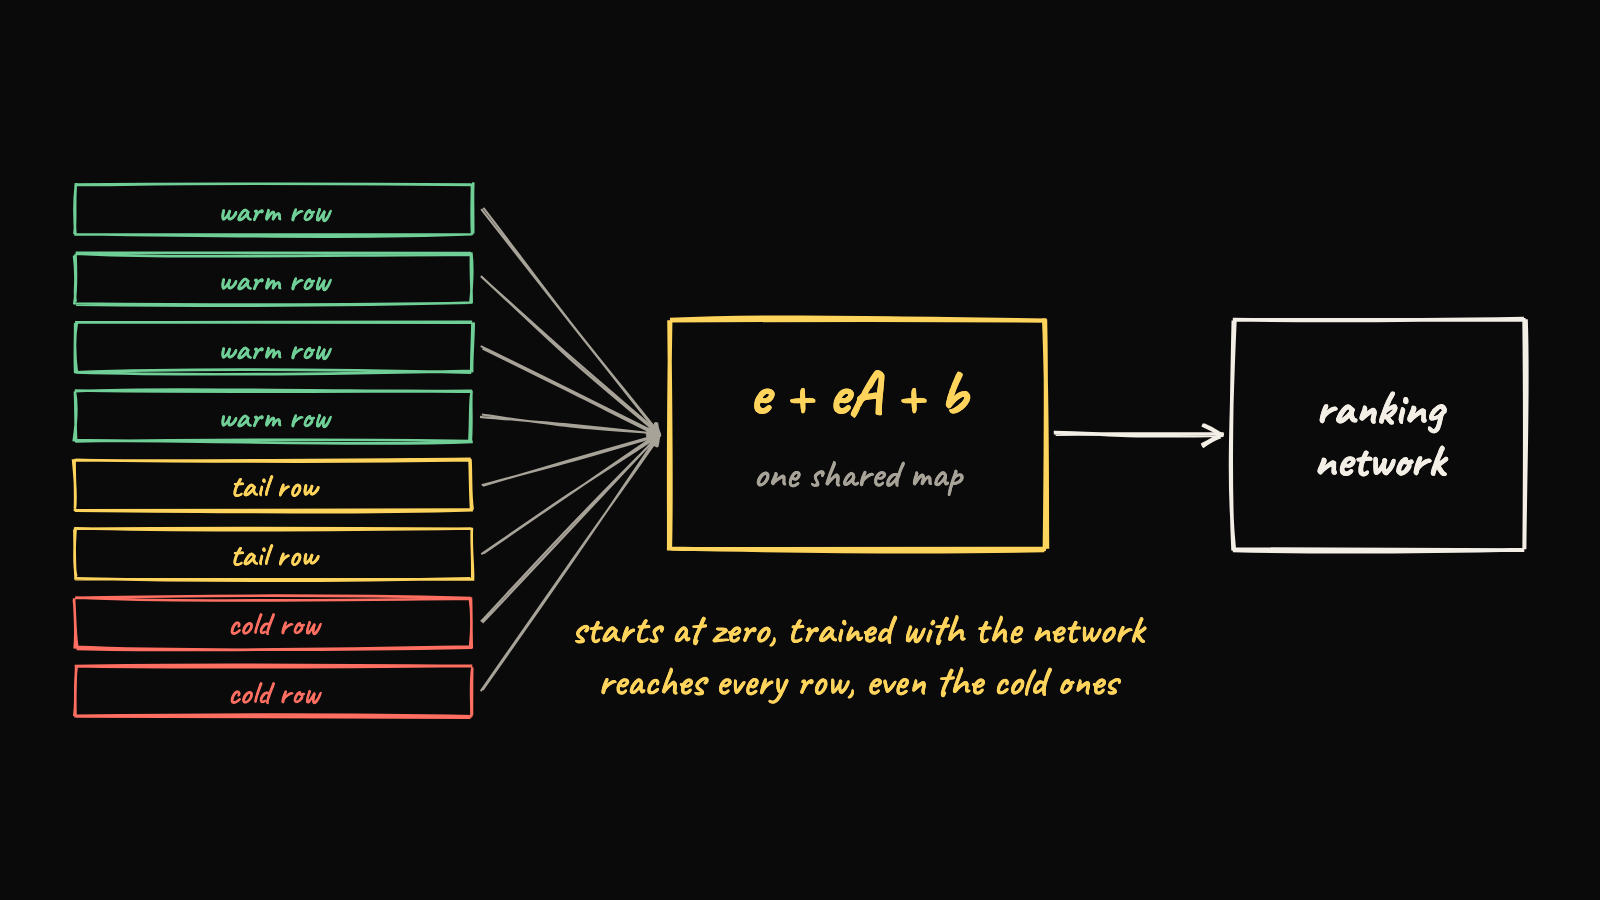
On top of a table that trains, though, it gave the biggest gain in the project. Full co-training plus the adapter beat plain full co-training by 0.98 ± 0.12 points and freeze-until-last by 0.76. Freeze-until-last plus the adapter was the best configuration I found at both learning rates, +0.88 over freeze-until-last at the default learning rate and +0.35 at the high one. A bias-only version gets 56 percent of the gain and a diagonal one 70 percent, so most of it is a shared shift and scale, not some clever rotation.
My hypothesis (and it is only a hypothesis) is that the adapter gives the systematic part of the fine-tuning signal a path that reaches every row at once, cold rows included, learned jointly with the network. Without it, that signal can only be written into rows that happen to get gradients, which is exactly the consistency problem. It isn't free everywhere: with full co-training at the high learning rate it made things slightly worse (−0.25), because when rows drift 15 times their own size, a shared shift is noise next to the per-row traces.
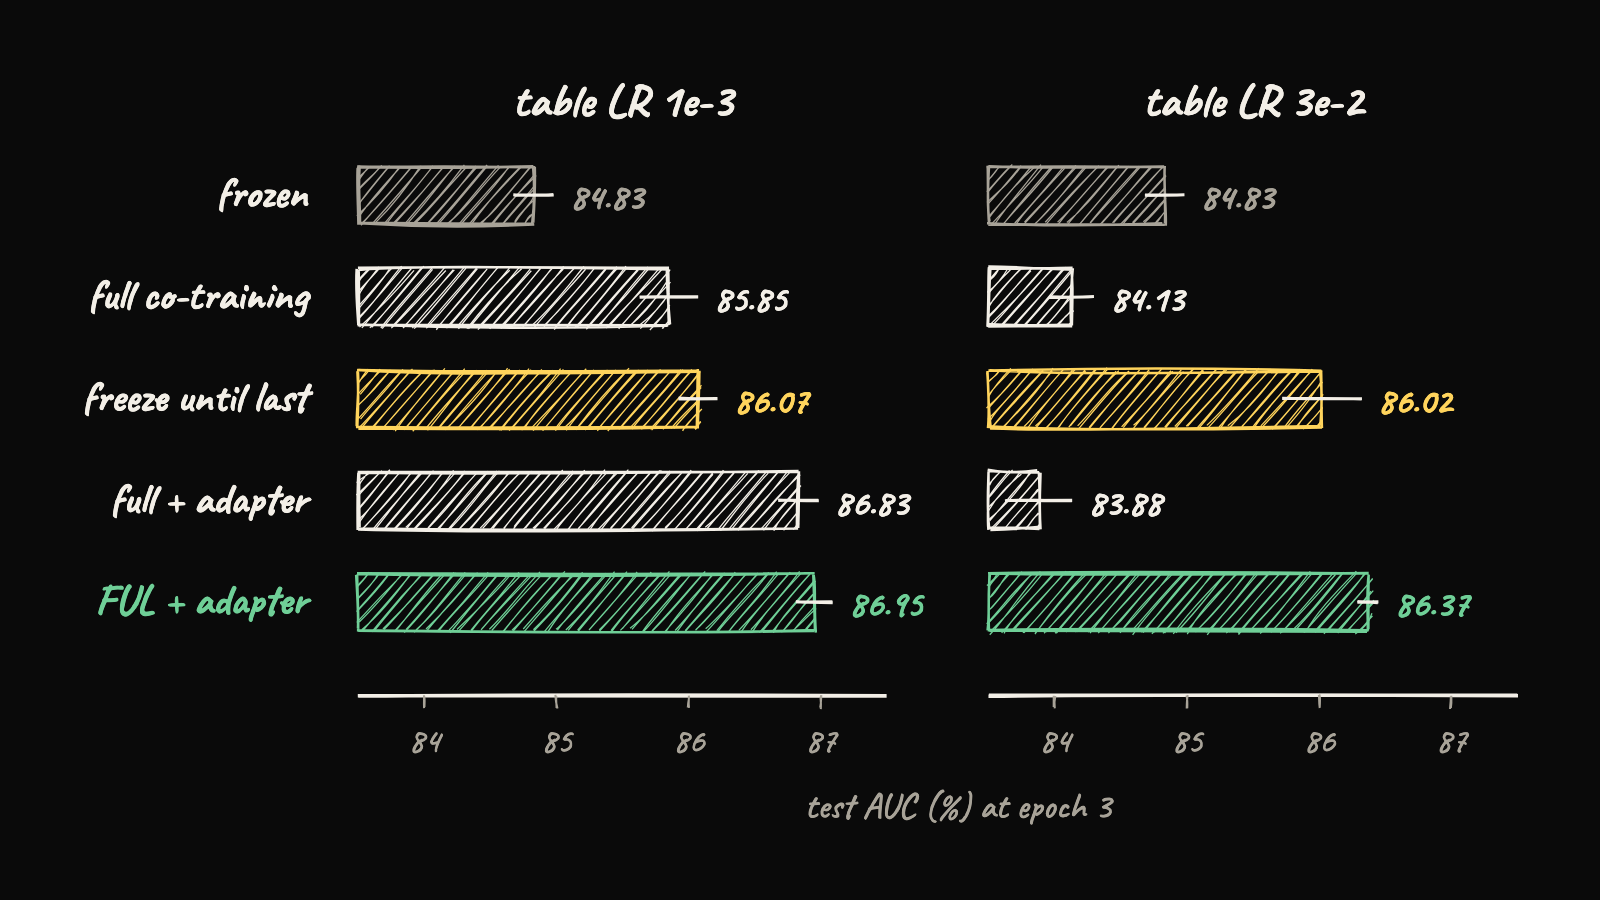
The x axis there starts at 83.5, so the bars exaggerate the gaps. The numbers next to them are the real ones.
things I was wrong about
The failures taught me as much as the wins, so here they are.
Repairing cold rows after training. If cold rows are stranded because they missed the warm rows' drift, why not move them along that drift at export time? I tried three ways: the average drift, a ridge-fitted affine map, and the drift of each cold item's nearest pretrained neighbours. All three made cold items worse, by 4.90, 2.95 and 3.56 points. The network and the table co-adapt as a pair, and editing one side afterwards breaks the deal. The adapter works because it's learned during training, not bolted on after.
Cross-fitted tables. The idea was to keep two copies of the table and have each example read only the copy written by the other half of the data, so no example ever sees its own trace. My first version updated each copy with gradients computed at the other copy, and it was unstable by construction: the difference between the two copies has no restoring force and just grows. Tail rows drifted 21.6 times their norm. A redesigned closed-loop version is stable and matches freeze-until-last on every warm tier (+0.06), while every row trains for all three epochs, but it still loses 1.30 points pooled, again to cold items.
My pre-registered ranking of fixes for the high learning rate had lazy Adam first and the drift cap last. Reality was close to the reverse.
the systems side
Pinterest's pipeline reads the next batch's embeddings before the current batch's backward pass finishes, so every lookup can be one update stale. Their justification is that consecutive batches share few IDs. The systems session tested that, and the conclusion holds, but the reason doesn't.
For item popularity following a Zipf distribution with exponent α, the fraction of a batch's lookups that hit a row the previous batch just updated has a clean closed form. It matched Monte Carlo to within 0.004 across 72 configurations. Once α gets past 1, most lookups are stale, however big the table is, because popular rows show up in nearly every batch. With a billion-row table and α = 1.2, it's still about 74 percent of candidate lookups.
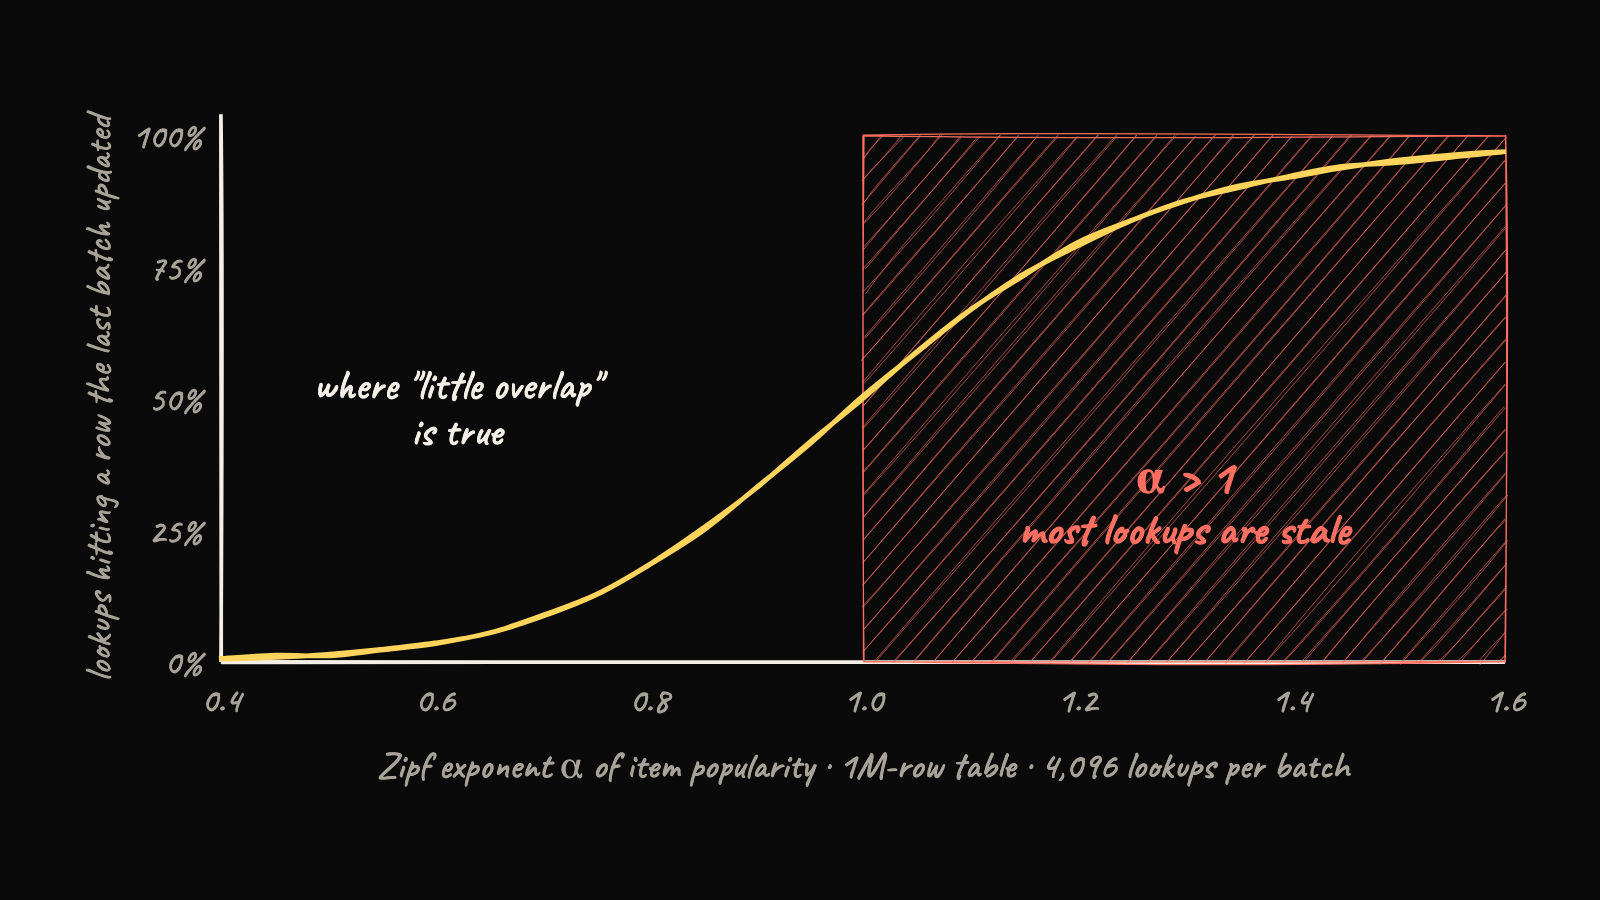
Staleness was still harmless in practice. With row-wise Adagrad or lazy Adam, one step of staleness changed test log-loss by at most 0.0017 even when 14 to 89 percent of lookups were stale. The real reason is that adaptive optimizers keep every row's step small. Staleness only hurts near the edge of stability: with plain SGD, the largest stable learning rate multiplier fell from 8 to 4 to 2 as staleness went from 0 to 1 to 4 steps, which is what the theory predicts.
Two more corrections. When gradient accumulation is used to amortise optimizer communication, Pinterest scales the embedding learning rate to approximate the accumulated update, because the fused embedding optimizer still steps on every microbatch. The obvious scaling, dividing by the number of microbatches, is exactly right for SGD, but with row-wise Adagrad or Adam it was the one choice that was clearly worse than true accumulation (+0.023 and +0.012 log-loss), and unscaled Adagrad already matched it. And the neat trick of turning a tiny table's backward pass into a matrix multiply, one_hotᵀ · grad, wins 1.8 to 2.8 times at 10 rows on a T4 but loses by about 30 to 60 rows. It also isn't bit-identical to the scatter-add in fp32, though it is deterministic and closer to the fp64 answer.
what I'd tell a team running into this
Fix the data before touching the schedule. Make sure no ID gets trained only through sampled negatives, because in my setup that was most of the problem and it looks exactly like overfitting.
Use a row-wise adaptive optimizer for the table. With row-wise Adagrad, plain multi-epoch co-training tied freeze-until-last and the epoch-3 drop never appeared.
If you can change one thing about the schedule, freeze until the last epoch. It's the most robust recipe here because it handles both self-influence and consistency.
Then try a zero-initialised shared adapter after the ID lookup, even just a learned bias, on top of freeze-until-last. It cost d² + d parameters and gave the best result in both regimes, but please validate it on your own data, because it's one dataset and three seeds.
And report AUC per item tier. In two of my four regimes the pooled number and the warm-item number pointed in opposite directions, which is how I almost missed my own bug.
for the nerds who want the receipts
Everything below is optional. Every number in this post is recomputed from the raw per-run logs of the Kaggle kernels in the receipts notebook on Kaggle, which checks 38 out of 38 quoted numbers against the logs and runs the analytic checks below live.
Setup. ML-20M, 10,000 users, temporal split 60/30/10 into pretrain, fine-tune and test. 16,093 items: 517 head, 1,169 torso, 3,076 tail by fine-tune support, and 11,331 cold. Item table d = 64, pretrained 40 epochs with an InfoNCE next-item loss at temperature 0.1. Ranking model: 2-layer, 2-head transformer over a 50-item history with cross-attention to the candidate, a 2-layer DCN plus a [256, 128] MLP, BCE heads, a pairwise loss and the contrastive loss at weight 0.5. Dense Adam at 1e-3 for the network, batch 512, 3 epochs, 4 negatives per positive drawn from popularity^0.75 over items available at that time. All runs on Kaggle T4s, and re-runs of the same config are bit-identical across kernels, so paired comparisons across kernels are exact.
Statistics. Every delta is per-seed paired over seeds 0, 1, 2 in AUC percentage points, mean ± sample std. With n = 3, three seeds agreeing in sign happens a quarter of the time by chance, so I only lean on effects that agree in sign and are about two standard deviations from zero.
The timing law. Reshuffle each epoch and let the table train during a one-epoch window starting at fraction s of a two-epoch run. An example is "written then replayed" if its row gets updated by that example and the example is seen again afterwards. Its epoch-1 position u₁ is uniform on [0, 1), so
which is linear in s and zero only when the window starts at the last epoch. The notebook simulates 200,000 examples and gets 1.0000, 0.7503, 0.4983, 0.2488 and 0 for s = 0, 0.25, 0.5, 0.75, 1.
The self-influence test. With tff meaning "train the table in the first third, then freeze",
computed per seed. +0.51 ± 0.16 at table LR 3e-2, −0.04 ± 0.13 at 1e-3. In the fresh arm, rows of items that only appear in the replayed chunk stay untrained, which adds stranding and biases this against finding self-influence.
Idle rows under dense Adam. After a single gradient g followed by zeros, with bias correction decayed, the total displacement of a row per unit learning rate is
against (1 − β₁)/√(1 − β₂) ≈ 3.16 for lazy Adam and 1 for the first row-wise Adagrad step on a single coordinate, η·g/√(g²). Row-wise Adagrad keeps one accumulator per row, Gᵢ ← Gᵢ + ‖gᵢ‖²/d, and steps by η·gᵢ/√Gᵢ, so a row's step shrinks with its own exposure.
Why gradient-swap cross-fitting blows up. Near an optimum x* with curvature H, table A is updated with the gradient at B and vice versa:
The sum A + B contracts, but the difference D = A − B follows D ← (I + ηH) D and grows every step. The closed-loop version fixes it by letting the network learn from out-of-fold reads with the tables detached, then updating each table with its own fold's loss evaluated through itself.
The adapter and the recipe that won.
E      = pretrained item table              # trainable only in the last epoch
A, b   = zeros(d, d), zeros(d)              # shared adapter, trained the whole time
for epoch in 1..3:
    table.requires_grad = (epoch == 3)
    if epoch == 3: reset table optimizer state
    for batch in shuffle(data):
        e   = E[batch.items]
        e   = e + e @ A + b                 # same map for every row, cold ones included
        loss = bce + pairwise + 0.5 * contrastive
        step(dense params, A, b)            # Adam
        if epoch == 3: step(E)              # row-wise Adagrad is the safer choice here
The optimizer reset matters. PyTorch's dense Adam keeps a single step counter per tensor, so rows unfrozen late would otherwise take bias-uncorrected first steps of about 3 times the learning rate. I only caught that because the smoke run of the stratified-unfreezing kernel looked wrong.
Stale lookups. With n lookups per batch, row probabilities pᵢ, and Sₖ the fraction of lookups reading a row updated in the previous k batches,
For α > 1, N_eff tends to ζ(α)²/ζ(2α) regardless of table size, about 62 at α = 1.1. For an SGD-like row update with effective step aᵢ ≈ η·h·pᵢ, k-step staleness stays stable only if the hottest row satisfies a_max < 2 sin(π / (2(2k + 1))), so 1, 0.62 and 0.35 for k = 1, 2, 4. Harm follows a_max, not the overlap fraction. Dense Adam read 99.7 percent stale lookups and was unharmed, while plain SGD with linear learning-rate scaling from batch 128 to 8192 saw 250 times more harm from only 1.6 times more overlap.
What this is not. One dataset slice, one small model, offline AUC and three seeds per arm. Pinterest's system is orders of magnitude larger, uses its own optimizer stack, and measures saves online, and nothing here says their result is wrong. The cross-fit redesign and the adapter ablations came from a follow-up kernel designed after seeing the first results, and the notebook labels them that way.
my honest take
I went in thinking I'd confirm a nice story about memorisation and come out with a better freezing schedule. Instead the biggest lesson was that a pooled metric can hide three mechanisms pulling in different directions, and that my own sampler could fake the headline effect almost perfectly. Freeze-until-last really is a good recipe, but in my runs it mostly works by keeping the table and the network consistent with each other, and a dumb little shared bias plus a row-wise optimizer gets you a surprising amount of the way there. If someone with a production-sized table tries the adapter, I'd genuinely love to know whether it survives contact with real traffic 🫡